|
FY2015 House 1 |
FY2015 House Final |
FY2015 Senate Final |
FY2015 GAA |
|
|---|---|---|---|---|
| Budget Tracking | 13,258,242 | 13,528,657 | 13,150,714 | 13,778,657 |
|
FY2012 GAA |
FY2013 GAA |
FY2014 GAA |
FY2014 Projected |
FY2015 GAA |
|
|---|---|---|---|---|---|
| Historical Budget Levels | 12,767,009 | 13,694,988 | 14,463,400 | 14,463,400 | 13,778,657 |
* GAA is General Appropriation Act.
| SPENDING CATEGORY |
FY2011 Expended |
FY2012 Expended |
FY2013 Expended |
FY2014 Projected |
FY2015 GAA |
|---|---|---|---|---|---|
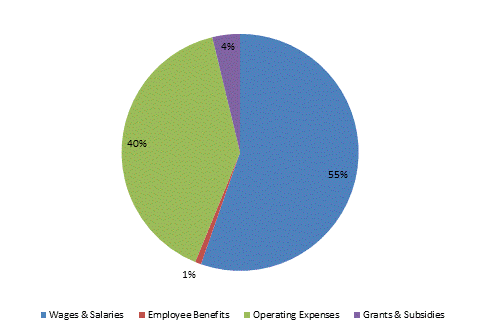
| Wages & Salaries | 7,547 | 7,516 | 8,559 | 8,638 | 7,628 |
| Employee Benefits | 144 | 146 | 104 | 116 | 114 |
| Operating Expenses | 5,075 | 5,105 | 4,886 | 5,084 | 5,516 |
| Grants & Subsidies | 0 | 0 | 0 | 626 | 520 |
| TOTAL | 12,766 | 12,767 | 13,549 | 14,463 | 13,779 |
FY2015 Spending Category Chart
