|
FY2015 House 1 |
FY2015 House Final |
FY2015 Senate Final |
FY2015 GAA |
|
|---|---|---|---|---|
| Budget Tracking | 167,344,144 | 125,199,718 | 136,946,602 | 140,299,718 |
|
FY2012 GAA |
FY2013 GAA |
FY2014 GAA |
FY2014 Projected |
FY2015 GAA |
|
|---|---|---|---|---|---|
| Historical Budget Levels | 97,797,200 | 80,042,354 | 90,406,700 | 105,450,266 | 140,299,718 |
* GAA is General Appropriation Act.
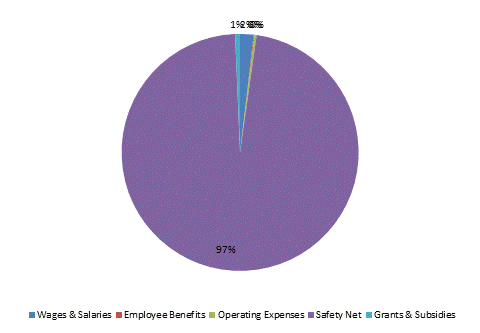
| SPENDING CATEGORY |
FY2011 Expended |
FY2012 Expended |
FY2013 Expended |
FY2014 Projected |
FY2015 GAA |
|---|---|---|---|---|---|
| Wages & Salaries | 2,190 | 1,933 | 2,250 | 2,636 | 2,576 |
| Employee Benefits | 136 | 131 | 137 | 183 | 157 |
| Operating Expenses | 50 | 168 | 275 | 309 | 406 |
| Safety Net | 155,209 | 131,872 | 85,755 | 101,400 | 136,210 |
| Grants & Subsidies | 1,400 | 1,158 | 950 | 923 | 950 |
| TOTAL | 158,984 | 135,262 | 89,366 | 105,450 | 140,300 |
FY2015 Spending Category Chart