|
FY2015 House 1 |
FY2015 House Final |
FY2015 Senate Final |
FY2015 GAA |
|
|---|---|---|---|---|
| Budget Tracking | 109,240,927 | 108,176,375 | 105,480,864 | 107,480,864 |
|
FY2012 GAA |
FY2013 GAA |
FY2014 GAA |
FY2014 Projected |
FY2015 GAA |
|
|---|---|---|---|---|---|
| Historical Budget Levels | 142,156,836 | 133,442,770 | 122,672,119 | 130,133,665 | 107,480,864 |
* GAA is General Appropriation Act.
| SPENDING CATEGORY |
FY2011 Expended |
FY2012 Expended |
FY2013 Expended |
FY2014 Projected |
FY2015 GAA |
|---|---|---|---|---|---|
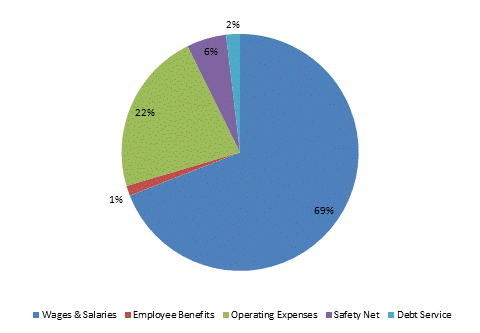
| Wages & Salaries | 113,948 | 105,925 | 96,101 | 93,718 | 74,208 |
| Employee Benefits | 2,480 | 2,763 | 1,702 | 1,774 | 1,485 |
| Operating Expenses | 36,816 | 35,489 | 28,638 | 28,379 | 23,929 |
| Safety Net | 6,324 | 6,425 | 7,077 | 6,263 | 5,816 |
| Debt Service | 0 | 0 | 0 | 0 | 2,043 |
| TOTAL | 159,568 | 150,602 | 133,518 | 130,134 | 107,481 |
FY2015 Spending Category Chart
