|
FY2015 House 1 |
FY2015 House Final |
FY2015 Senate Final |
FY2015 GAA |
|
|---|---|---|---|---|
| Budget Tracking | 357,269,145 | 366,572,453 | 357,969,145 | 360,697,453 |
|
FY2012 GAA |
FY2013 GAA |
FY2014 GAA |
FY2014 Projected |
FY2015 GAA |
|
|---|---|---|---|---|---|
| Historical Budget Levels | 329,285,802 | 344,027,150 | 353,868,606 | 353,168,606 | 360,697,453 |
* GAA is General Appropriation Act.
| SPENDING CATEGORY |
FY2011 Expended |
FY2012 Expended |
FY2013 Expended |
FY2014 Projected |
FY2015 GAA |
|---|---|---|---|---|---|
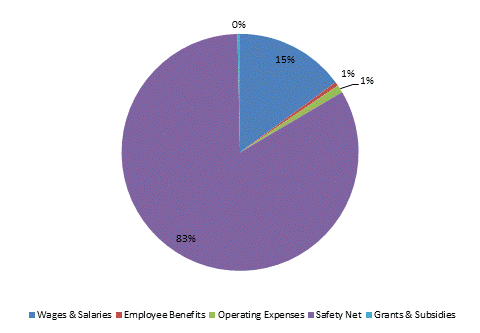
| Wages & Salaries | 48,294 | 49,926 | 52,316 | 54,788 | 53,813 |
| Employee Benefits | 2,016 | 1,924 | 1,789 | 1,946 | 1,957 |
| Operating Expenses | 3,007 | 3,180 | 3,150 | 3,800 | 3,816 |
| Safety Net | 263,597 | 274,666 | 284,199 | 291,719 | 299,865 |
| Grants & Subsidies | 344 | 445 | 568 | 916 | 1,247 |
| TOTAL | 317,257 | 330,141 | 342,023 | 353,169 | 360,697 |
FY2015 Spending Category Chart
