|
FY2015 House 1 |
FY2015 House Final |
FY2015 Senate Final |
FY2015 GAA |
|
|---|---|---|---|---|
| Budget Tracking | 3,973,096 | 3,868,096 | 3,973,096 | 3,868,096 |
|
FY2012 GAA |
FY2013 GAA |
FY2014 GAA |
FY2014 Projected |
FY2015 GAA |
|
|---|---|---|---|---|---|
| Historical Budget Levels | 4,150,703 | 4,151,958 | 3,972,621 | 3,973,137 | 3,868,096 |
* GAA is General Appropriation Act.
| SPENDING CATEGORY |
FY2011 Expended |
FY2012 Expended |
FY2013 Expended |
FY2014 Projected |
FY2015 GAA |
|---|---|---|---|---|---|
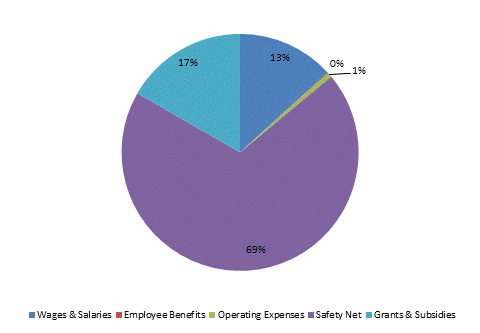
| Wages & Salaries | 777 | 742 | 583 | 511 | 511 |
| Employee Benefits | 7 | 12 | 1 | 5 | 5 |
| Operating Expenses | 16 | 28 | 27 | 25 | 25 |
| Safety Net | 3,061 | 2,689 | 2,849 | 2,786 | 2,681 |
| Grants & Subsidies | 598 | 648 | 648 | 646 | 646 |
| TOTAL | 4,458 | 4,119 | 4,107 | 3,973 | 3,868 |
FY2015 Spending Category Chart
