|
FY2015 House 1 |
FY2015 House Final |
FY2015 Senate Final |
FY2015 GAA |
|
|---|---|---|---|---|
| Budget Tracking | 20,346,607 | 19,573,184 | 20,537,556 | 20,055,370 |
|
FY2012 GAA |
FY2013 GAA |
FY2014 GAA |
FY2014 Projected |
FY2015 GAA |
|
|---|---|---|---|---|---|
| Historical Budget Levels | 15,394,748 | 17,871,474 | 18,796,603 | 18,796,603 | 20,055,370 |
* GAA is General Appropriation Act.
| SPENDING CATEGORY |
FY2011 Expended |
FY2012 Expended |
FY2013 Expended |
FY2014 Projected |
FY2015 GAA |
|---|---|---|---|---|---|
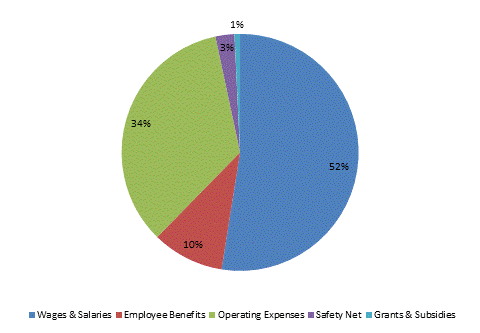
| Wages & Salaries | 10,531 | 9,168 | 9,971 | 10,865 | 10,530 |
| Employee Benefits | 1,962 | 1,941 | 1,834 | 1,878 | 1,970 |
| Operating Expenses | 4,788 | 4,963 | 5,154 | 5,211 | 6,884 |
| Safety Net | 0 | 367 | 367 | 690 | 517 |
| Grants & Subsidies | 0 | 87 | 88 | 153 | 153 |
| TOTAL | 17,281 | 16,527 | 17,413 | 18,797 | 20,055 |
FY2015 Spending Category Chart
