|
FY2015 House 1 |
FY2015 House Final |
FY2015 Senate Final |
FY2015 GAA |
|
|---|---|---|---|---|
| Budget Tracking | 118,348,171 | 118,064,994 | 118,353,960 | 118,064,994 |
|
FY2012 GAA |
FY2013 GAA |
FY2014 GAA |
FY2014 Projected |
FY2015 GAA |
|
|---|---|---|---|---|---|
| Historical Budget Levels | 95,970,712 | 102,919,356 | 106,622,349 | 109,996,086 | 118,064,994 |
* GAA is General Appropriation Act.
| SPENDING CATEGORY |
FY2011 Expended |
FY2012 Expended |
FY2013 Expended |
FY2014 Projected |
FY2015 GAA |
|---|---|---|---|---|---|
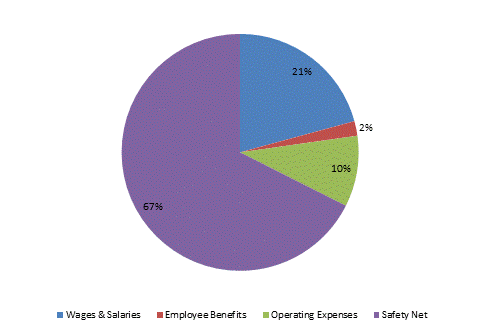
| Wages & Salaries | 20,314 | 20,612 | 21,886 | 22,090 | 24,516 |
| Employee Benefits | 1,419 | 1,859 | 1,931 | 2,248 | 2,348 |
| Operating Expenses | 8,637 | 8,326 | 9,024 | 11,202 | 11,442 |
| Safety Net | 65,292 | 65,417 | 67,493 | 74,456 | 79,759 |
| TOTAL | 95,663 | 96,213 | 100,334 | 109,996 | 118,065 |
FY2015 Spending Category Chart
