|
FY2015 House 1 |
FY2015 House Final |
FY2015 Senate Final |
FY2015 GAA |
|
|---|---|---|---|---|
| Budget Tracking | 2,366,012,322 | 2,367,151,217 | 2,381,520,091 | 2,381,458,986 |
|
FY2012 GAA |
FY2013 GAA |
FY2014 GAA |
FY2014 Projected |
FY2015 GAA |
|
|---|---|---|---|---|---|
| Historical Budget Levels | 2,029,206,633 | 1,957,480,126 | 2,196,315,039 | 2,144,775,985 | 2,381,458,986 |
* GAA is General Appropriation Act.
| SPENDING CATEGORY |
FY2011 Expended |
FY2012 Expended |
FY2013 Expended |
FY2014 Projected |
FY2015 GAA |
|---|---|---|---|---|---|
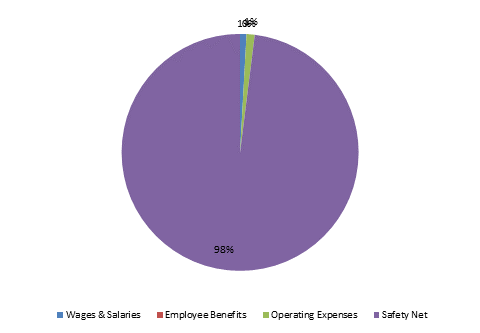
| Wages & Salaries | 9,586 | 11,370 | 11,772 | 14,801 | 20,674 |
| Employee Benefits | 7 | 6 | 1 | 45 | 5 |
| Operating Expenses | 11,217 | 9,324 | 9,640 | 17,618 | 26,428 |
| Safety Net | 1,839,864 | 1,824,007 | 1,884,952 | 2,071,811 | 2,334,352 |
| Grants & Subsidies | 5,130 | 3,000 | 0 | 40,500 | 0 |
| TOTAL | 1,865,804 | 1,847,706 | 1,906,365 | 2,144,776 | 2,381,459 |
FY2015 Spending Category Chart
