|
FY2015 House 1 |
FY2015 House Final |
FY2015 Senate Final |
FY2015 GAA |
|
|---|---|---|---|---|
| Budget Tracking | 523,708 | 494,253 | 400,000 | 494,256 |
|
FY2012 GAA |
FY2013 GAA |
FY2014 GAA |
FY2014 Projected |
FY2015 GAA |
|
|---|---|---|---|---|---|
| Historical Budget Levels | 350,000 | 400,000 | 400,000 | 400,001 | 494,256 |
* GAA is General Appropriation Act.
| SPENDING CATEGORY |
FY2011 Expended |
FY2012 Expended |
FY2013 Expended |
FY2014 Projected |
FY2015 GAA |
|---|---|---|---|---|---|
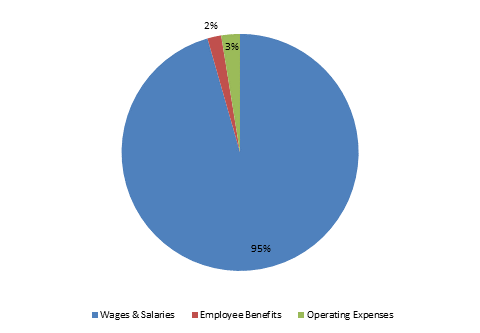
| Wages & Salaries | 0 | 264 | 389 | 394 | 472 |
| Employee Benefits | 0 | 6 | 10 | 6 | 9 |
| Operating Expenses | 0 | 56 | 0 | 0 | 13 |
| TOTAL | 0 | 326 | 399 | 400 | 494 |
FY2015 Spending Category Chart
