Budget Detail
9600-0000 - House of Representatives Operations
Data Current as of: 10/17/2014
|
FY2015 House 1 |
FY2015 House Final |
FY2015 Senate Final |
FY2015 GAA |
|
|---|---|---|---|---|
| Budget Tracking | 39,104,470 | 39,104,470 | 39,104,470 | 39,104,470 |
|
FY2012 GAA |
FY2013 GAA |
FY2014 GAA |
FY2014 Projected |
FY2015 GAA |
|
|---|---|---|---|---|---|
| Historical Budget Levels | 34,324,791 | 35,393,116 | 38,337,716 | 31,056,242 | 39,104,470 |
* GAA is General Appropriation Act.
| SPENDING CATEGORY |
FY2011 Expended |
FY2012 Expended |
FY2013 Expended |
FY2014 Projected |
FY2015 GAA |
|---|---|---|---|---|---|
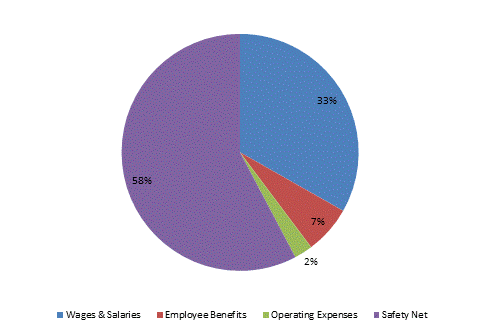
| Wages & Salaries | 31,612 | 31,424 | 31,178 | 4,940 | 12,990 |
| Employee Benefits | 1,186 | 1,124 | 890 | 2,560 | 2,558 |
| Operating Expenses | 459 | 272 | 362 | 989 | 989 |
| Safety Net | 0 | 0 | 0 | 22,568 | 22,568 |
| TOTAL | 33,256 | 32,821 | 32,430 | 31,056 | 39,104 |
FY2015 Spending Category Chart
