| SPENDING CATEGORY |
FY2010 Expended |
FY2011 Expended |
FY2012 Expended |
FY2013 Projected |
FY2014 GAA |
|---|---|---|---|---|---|
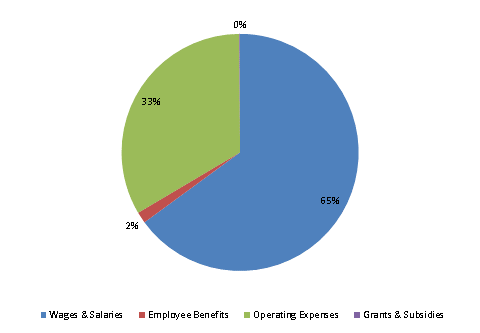
| Wages & Salaries | 25,796 | 24,198 | 23,726 | 26,342 | 23,587 |
| Employee Benefits | 593 | 635 | 610 | 569 | 559 |
| Operating Expenses | 13,019 | 12,873 | 10,495 | 26,622 | 12,127 |
| Grants & Subsidies | 8,315 | 1,683 | 1,060 | 1,706 | 44 |
| TOTAL | 47,724 | 39,389 | 35,891 | 55,239 | 36,317 |
FY2014 Spending Category Chart
