| SPENDING CATEGORY |
FY2010 Expended |
FY2011 Expended |
FY2012 Expended |
FY2013 Projected |
FY2014 GAA |
|---|---|---|---|---|---|
| Wages & Salaries | 1,592 | 1,476 | 1,561 | 1,635 | 1,667 |
| Employee Benefits | 25 | 35 | 34 | 31 | 32 |
| Operating Expenses | 1,525 | 917 | 915 | 1,748 | 1,773 |
| Grants & Subsidies | 0 | 0 | 0 | 1,100 | 43,390 |
| TOTAL | 3,142 | 2,427 | 2,510 | 4,514 | 46,862 |
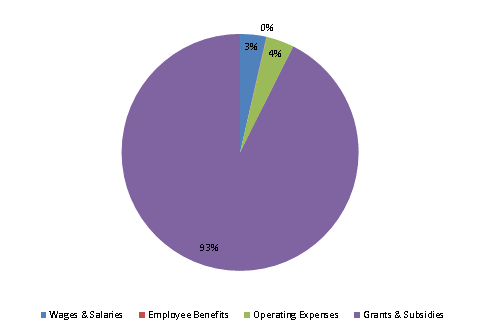
FY2014 Spending Category Chart