|
FY2014 House 1 |
FY2014 House Final |
FY2014 Senate Final |
FY2014 GAA |
|
|---|---|---|---|---|
| Budget Tracking | 41,484,943 | 43,577,900 | 41,082,336 | 42,688,571 |
|
FY2011 GAA |
FY2012 GAA |
FY2013 GAA |
FY2013 Projected |
FY2014 GAA |
|
|---|---|---|---|---|---|
| Historical Budget Levels | 40,139,577 | 39,729,986 | 40,282,336 | 40,671,513 | 42,688,571 |
* GAA is General Appropriation Act.
| SPENDING CATEGORY |
FY2010 Expended |
FY2011 Expended |
FY2012 Expended |
FY2013 Projected |
FY2014 GAA |
|---|---|---|---|---|---|
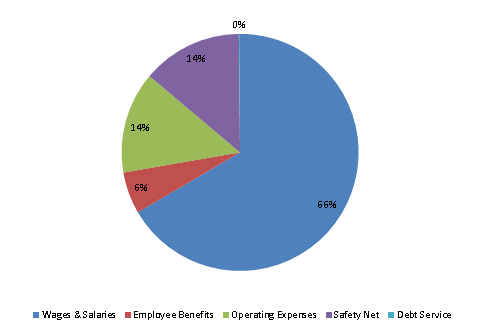
| Wages & Salaries | 29,986 | 30,517 | 28,389 | 28,606 | 28,415 |
| Employee Benefits | 2,072 | 2,641 | 2,508 | 2,404 | 2,437 |
| Operating Expenses | 6,291 | 5,822 | 5,340 | 4,800 | 5,918 |
| Safety Net | 2,324 | 1,970 | 4,327 | 4,850 | 5,849 |
| Debt Service | 0 | 0 | 11 | 11 | 70 |
| TOTAL | 40,674 | 40,950 | 40,574 | 40,672 | 42,689 |
FY2014 Spending Category Chart
