|
FY2014 House 1 |
FY2014 House Final |
FY2014 Senate Final |
FY2014 GAA |
|
|---|---|---|---|---|
| Budget Tracking | 561,527,475 | 547,837,917 | 542,976,975 | 547,113,917 |
|
FY2011 GAA |
FY2012 GAA |
FY2013 GAA |
FY2013 Projected |
FY2014 GAA |
|
|---|---|---|---|---|---|
| Historical Budget Levels | 494,964,501 | 509,360,246 | 541,217,210 | 542,867,210 | 547,113,917 |
* GAA is General Appropriation Act.
| SPENDING CATEGORY |
FY2010 Expended |
FY2011 Expended |
FY2012 Expended |
FY2013 Projected |
FY2014 GAA |
|---|---|---|---|---|---|
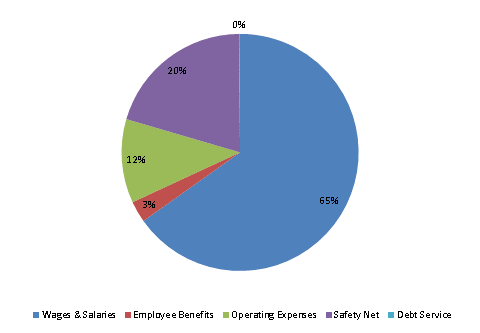
| Wages & Salaries | 334,906 | 330,047 | 333,205 | 354,715 | 356,594 |
| Employee Benefits | 17,223 | 17,518 | 16,940 | 15,681 | 15,922 |
| Operating Expenses | 59,568 | 61,248 | 60,736 | 63,557 | 62,609 |
| Safety Net | 102,453 | 101,535 | 105,737 | 108,802 | 111,249 |
| Grants & Subsidies | 0 | 200 | 1,450 | 50 | 0 |
| Debt Service | 0 | 0 | 62 | 62 | 740 |
| TOTAL | 514,150 | 510,547 | 518,131 | 542,867 | 547,114 |
FY2014 Spending Category Chart
