|
FY2014 House 1 |
FY2014 House Final |
FY2014 Senate Final |
FY2014 GAA |
|
|---|---|---|---|---|
| Budget Tracking | 2,199,961 | 2,200,256 | 2,200,257 | 2,200,256 |
|
FY2011 GAA |
FY2012 GAA |
FY2013 GAA |
FY2013 Projected |
FY2014 GAA |
|
|---|---|---|---|---|---|
| Historical Budget Levels | 2,267,426 | 2,272,509 | 2,197,411 | 3,197,411 | 2,200,256 |
* GAA is General Appropriation Act.
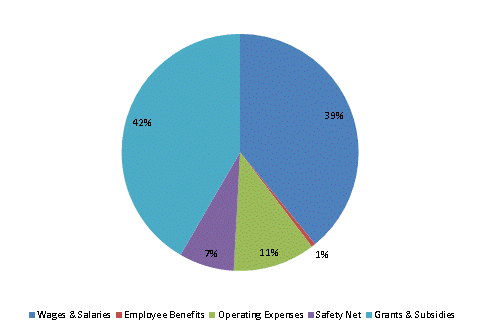
| SPENDING CATEGORY |
FY2010 Expended |
FY2011 Expended |
FY2012 Expended |
FY2013 Projected |
FY2014 GAA |
|---|---|---|---|---|---|
| Wages & Salaries | 296 | 423 | 871 | 1,857 | 860 |
| Employee Benefits | 0 | 3 | 17 | 12 | 12 |
| Operating Expenses | 0 | 247 | 287 | 247 | 247 |
| Safety Net | 73 | 210 | 168 | 165 | 165 |
| Grants & Subsidies | 755 | 1,379 | 928 | 916 | 916 |
| TOTAL | 1,125 | 2,262 | 2,271 | 3,197 | 2,200 |
FY2014 Spending Category Chart