|
FY2014 House 1 |
FY2014 House Final |
FY2014 Senate Final |
FY2014 GAA |
|
|---|---|---|---|---|
| Budget Tracking | 90,598,693 | 88,785,816 | 88,247,730 | 91,785,813 |
|
FY2011 GAA |
FY2012 GAA |
FY2013 GAA |
FY2013 Projected |
FY2014 GAA |
|
|---|---|---|---|---|---|
| Historical Budget Levels | 86,970,271 | 83,484,473 | 87,224,888 | 87,844,889 | 91,785,813 |
* GAA is General Appropriation Act.
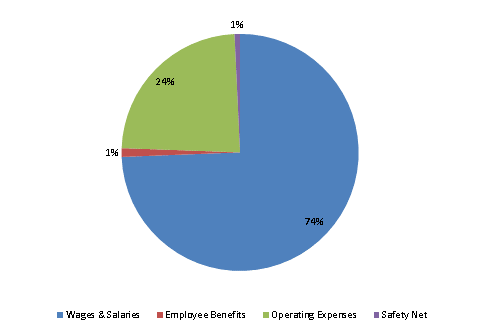
| SPENDING CATEGORY |
FY2010 Expended |
FY2011 Expended |
FY2012 Expended |
FY2013 Projected |
FY2014 GAA |
|---|---|---|---|---|---|
| Wages & Salaries | 66,037 | 62,857 | 58,684 | 61,517 | 68,281 |
| Employee Benefits | 1,114 | 1,333 | 1,273 | 1,034 | 1,084 |
| Operating Expenses | 19,396 | 19,066 | 21,104 | 22,211 | 21,731 |
| Safety Net | 4,261 | 3,574 | 3,245 | 664 | 690 |
| Grants & Subsidies | 0 | 0 | 0 | 2,420 | 0 |
| TOTAL | 90,808 | 86,829 | 84,306 | 87,845 | 91,786 |
FY2014 Spending Category Chart