|
FY2014 House 1 |
FY2014 House Final |
FY2014 Senate Final |
FY2014 GAA |
|
|---|---|---|---|---|
| Budget Tracking | 43,899,928 | 41,801,239 | 41,444,957 | 42,554,957 |
|
FY2011 GAA |
FY2012 GAA |
FY2013 GAA |
FY2013 Projected |
FY2014 GAA |
|
|---|---|---|---|---|---|
| Historical Budget Levels | 40,297,772 | 42,173,702 | 41,409,387 | 40,209,387 | 42,554,957 |
* GAA is General Appropriation Act.
| SPENDING CATEGORY |
FY2010 Expended |
FY2011 Expended |
FY2012 Expended |
FY2013 Projected |
FY2014 GAA |
|---|---|---|---|---|---|
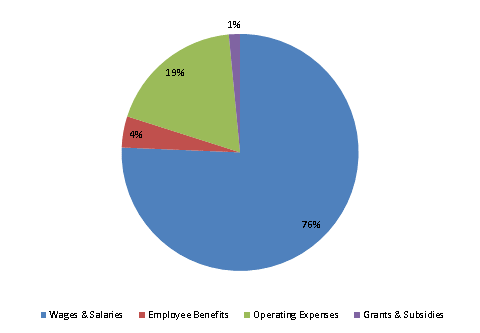
| Wages & Salaries | 31,842 | 30,409 | 29,454 | 30,084 | 32,197 |
| Employee Benefits | 1,593 | 1,762 | 1,895 | 1,741 | 1,809 |
| Operating Expenses | 10,256 | 9,397 | 9,775 | 8,259 | 7,901 |
| Grants & Subsidies | 130 | 125 | 125 | 125 | 648 |
| TOTAL | 43,820 | 41,693 | 41,249 | 40,209 | 42,555 |
FY2014 Spending Category Chart
