|
FY2014 House 1 |
FY2014 House Final |
FY2014 Senate Final |
FY2014 GAA |
|
|---|---|---|---|---|
| Budget Tracking | 5,202,777 | 5,380,914 | 5,380,914 | 5,380,914 |
|
FY2011 GAA |
FY2012 GAA |
FY2013 GAA |
FY2013 Projected |
FY2014 GAA |
|
|---|---|---|---|---|---|
| Historical Budget Levels | 7,642,958 | 4,900,000 | 8,646,892 | 22,315,388 | 5,380,914 |
* GAA is General Appropriation Act.
| SPENDING CATEGORY |
FY2010 Expended |
FY2011 Expended |
FY2012 Expended |
FY2013 Projected |
FY2014 GAA |
|---|---|---|---|---|---|
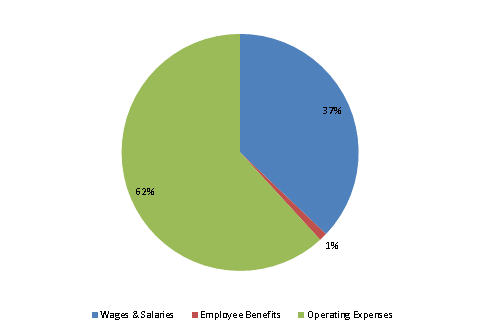
| Wages & Salaries | 1,844 | 1,974 | 1,895 | 15,548 | 1,996 |
| Employee Benefits | 51 | 45 | 66 | 57 | 59 |
| Operating Expenses | 1,431 | 3,265 | 2,772 | 5,055 | 3,326 |
| Grants & Subsidies | 105 | 1,654 | 1,022 | 1,656 | 0 |
| TOTAL | 3,431 | 6,939 | 5,754 | 22,315 | 5,381 |
FY2014 Spending Category Chart
