Budget Detail
9600-0000 - House of Representatives Operations
Data Current as of: 9/11/2013
|
FY2014 House 1 |
FY2014 House Final |
FY2014 Senate Final |
FY2014 GAA |
|
|---|---|---|---|---|
| Budget Tracking | 38,337,716 | 38,337,716 | 38,337,716 | 38,337,716 |
|
FY2011 GAA |
FY2012 GAA |
FY2013 GAA |
FY2013 Projected |
FY2014 GAA |
|
|---|---|---|---|---|---|
| Historical Budget Levels | 28,814,620 | 34,324,791 | 35,393,116 | 37,585,996 | 38,337,716 |
* GAA is General Appropriation Act.
| SPENDING CATEGORY |
FY2010 Expended |
FY2011 Expended |
FY2012 Expended |
FY2013 Projected |
FY2014 GAA |
|---|---|---|---|---|---|
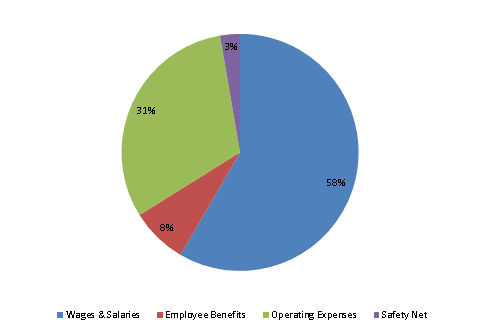
| Wages & Salaries | 32,741 | 31,612 | 31,424 | 21,903 | 22,379 |
| Employee Benefits | 1,023 | 1,186 | 1,124 | 2,690 | 2,969 |
| Operating Expenses | 560 | 459 | 272 | 11,955 | 11,952 |
| Safety Net | 0 | 0 | 0 | 1,038 | 1,038 |
| TOTAL | 34,325 | 33,256 | 32,821 | 37,586 | 38,338 |
FY2014 Spending Category Chart
