Budget Detail
7003-0500 - Department of Industrial Accidents
Data Current as of: 9/11/2013
|
FY2014 House 1 |
FY2014 House Final |
FY2014 Senate Final |
FY2014 GAA |
|
|---|---|---|---|---|
| Budget Tracking | 19,522,205 | 19,442,653 | 19,522,205 | 19,522,205 |
|
FY2011 GAA |
FY2012 GAA |
FY2013 GAA |
FY2013 Projected |
FY2014 GAA |
|
|---|---|---|---|---|---|
| Historical Budget Levels | 0 | 19,106,544 | 19,114,446 | 19,114,445 | 19,522,205 |
* GAA is General Appropriation Act.
| SPENDING CATEGORY |
FY2010 Expended |
FY2011 Expended |
FY2012 Expended |
FY2013 Projected |
FY2014 GAA |
|---|---|---|---|---|---|
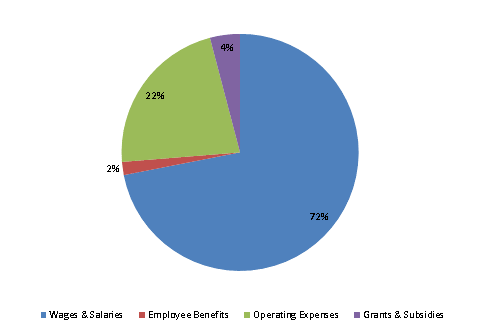
| Wages & Salaries | 0 | 0 | 13,080 | 14,049 | 14,042 |
| Employee Benefits | 0 | 0 | 361 | 319 | 349 |
| Operating Expenses | 0 | 0 | 2,998 | 3,946 | 4,332 |
| Grants & Subsidies | 0 | 0 | 438 | 800 | 800 |
| TOTAL | 0 | 0 | 16,877 | 19,114 | 19,522 |
FY2014 Spending Category Chart
