| SPENDING CATEGORY |
FY2009 Expended |
FY2010 Expended |
FY2011 Expended |
FY2012 Projected |
FY2013 GAA |
|---|---|---|---|---|---|
| Wages & Salaries | 22,470 | 18,747 | 20,839 | 20,279 | 20,468 |
| Employee Benefits | 316 | 269 | 416 | 293 | 365 |
| Operating Expenses | 0 | 0 | 0 | 0 | 238 |
| Grants & Subsidies | 535 | 0 | 0 | 498 | 0 |
| TOTAL | 23,321 | 19,016 | 21,255 | 21,070 | 21,070 |
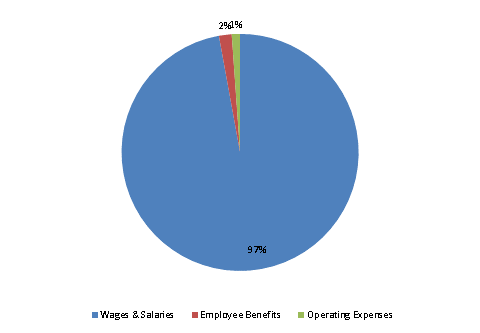
FY2013 Spending Category Chart