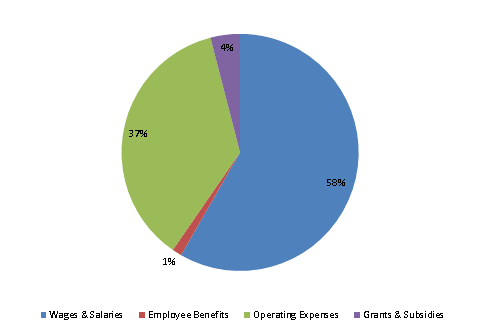
| SPENDING CATEGORY |
FY2009 Expended |
FY2010 Expended |
FY2011 Expended |
FY2012 Projected |
FY2013 GAA |
|---|---|---|---|---|---|
| Wages & Salaries | 27,427 | 25,796 | 24,198 | 24,336 | 23,991 |
| Employee Benefits | 642 | 593 | 635 | 572 | 537 |
| Operating Expenses | 17,237 | 13,019 | 12,873 | 10,159 | 14,963 |
| Safety Net | 0 | 0 | 0 | 62 | 0 |
| Grants & Subsidies | 1,590 | 8,315 | 1,683 | 860 | 1,656 |
| TOTAL | 46,896 | 47,724 | 39,389 | 35,990 | 41,146 |
FY2013 Spending Category Chart