| SPENDING CATEGORY |
FY2009 Expended |
FY2010 Expended |
FY2011 Expended |
FY2012 Projected |
FY2013 GAA |
|---|---|---|---|---|---|
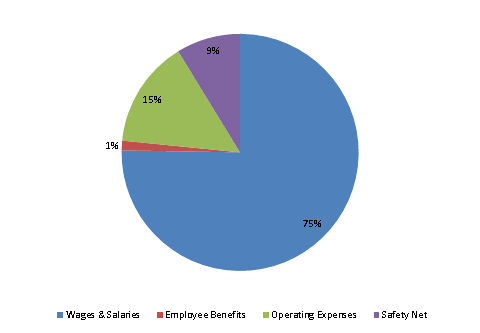
| Wages & Salaries | 29,772 | 27,768 | 27,991 | 29,445 | 29,208 |
| Employee Benefits | 654 | 564 | 682 | 716 | 510 |
| Operating Expenses | 7,049 | 6,158 | 5,946 | 6,014 | 5,699 |
| Safety Net | 2,188 | 2,188 | 2,188 | 2,188 | 3,388 |
| Grants & Subsidies | 1,420 | 0 | 0 | 0 | 0 |
| TOTAL | 41,083 | 36,679 | 36,807 | 38,362 | 38,806 |
FY2013 Spending Category Chart
