|
FY2013 House 1 |
FY2013 House Final |
FY2013 Senate Final |
FY2013 GAA |
|
|---|---|---|---|---|
| Budget Tracking | 26,554,582 | 25,783,339 | 26,041,172 | 27,783,339 |
|
FY2010 GAA |
FY2011 GAA |
FY2012 GAA |
FY2012 Projected |
FY2013 GAA |
|
|---|---|---|---|---|---|
| Historical Budget Levels | 0 | 23,560,758 | 24,910,825 | 31,254,584 | 27,783,339 |
* GAA is General Appropriation Act.
| SPENDING CATEGORY |
FY2009 Expended |
FY2010 Expended |
FY2011 Expended |
FY2012 Projected |
FY2013 GAA |
|---|---|---|---|---|---|
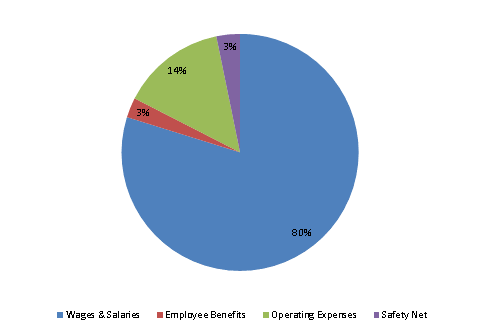
| Wages & Salaries | 0 | 10,621 | 24,650 | 25,383 | 22,173 |
| Employee Benefits | 0 | 533 | 865 | 1,126 | 757 |
| Operating Expenses | 0 | 1,591 | 2,921 | 3,836 | 3,961 |
| Safety Net | 0 | 624 | 709 | 910 | 892 |
| TOTAL | 0 | 13,368 | 29,146 | 31,255 | 27,783 |
FY2013 Spending Category Chart
