|
FY2013 House 1 |
FY2013 House Final |
FY2013 Senate Final |
FY2013 GAA |
|
|---|---|---|---|---|
| Budget Tracking | 747,844 | 747,844 | 747,844 | 747,844 |
|
FY2010 GAA |
FY2011 GAA |
FY2012 GAA |
FY2012 Projected |
FY2013 GAA |
|
|---|---|---|---|---|---|
| Historical Budget Levels | 0 | 763,105 | 747,844 | 747,844 | 747,844 |
* GAA is General Appropriation Act.
| SPENDING CATEGORY |
FY2009 Expended |
FY2010 Expended |
FY2011 Expended |
FY2012 Projected |
FY2013 GAA |
|---|---|---|---|---|---|
| Wages & Salaries | 0 | 139 | 280 | 641 | 641 |
| Employee Benefits | 0 | 2 | 7 | 48 | 48 |
| Operating Expenses | 0 | 103 | 365 | 59 | 59 |
| TOTAL | 0 | 245 | 651 | 748 | 748 |
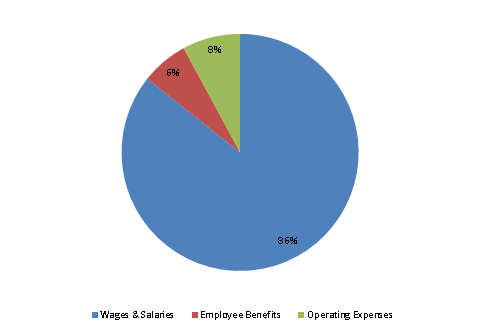
FY2013 Spending Category Chart