|
FY2013 House 1 |
FY2013 House Final |
FY2013 Senate Final |
FY2013 GAA |
|
|---|---|---|---|---|
| Budget Tracking | 158,248 | 158,248 | 158,248 | 158,248 |
|
FY2010 GAA |
FY2011 GAA |
FY2012 GAA |
FY2012 Projected |
FY2013 GAA |
|
|---|---|---|---|---|---|
| Historical Budget Levels | 250,000 | 250,000 | 158,068 | 158,068 | 158,248 |
* GAA is General Appropriation Act.
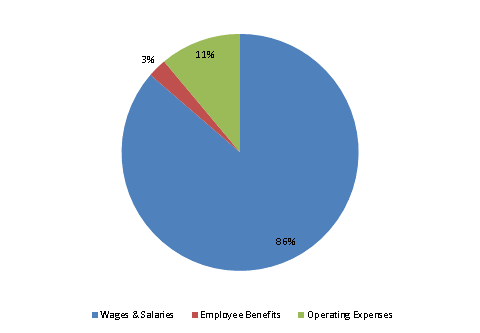
| SPENDING CATEGORY |
FY2009 Expended |
FY2010 Expended |
FY2011 Expended |
FY2012 Projected |
FY2013 GAA |
|---|---|---|---|---|---|
| Wages & Salaries | 139 | 113 | 125 | 133 | 137 |
| Employee Benefits | 6 | 3 | 4 | 1 | 4 |
| Operating Expenses | 14 | 42 | 30 | 24 | 18 |
| TOTAL | 158 | 158 | 158 | 158 | 158 |
FY2013 Spending Category Chart