|
FY2013 House 1 |
FY2013 House Final |
FY2013 Senate Final |
FY2013 GAA |
|
|---|---|---|---|---|
| Budget Tracking | 500,000 | 500,000 | 500,000 | 500,000 |
|
FY2010 GAA |
FY2011 GAA |
FY2012 GAA |
FY2012 Projected |
FY2013 GAA |
|
|---|---|---|---|---|---|
| Historical Budget Levels | 1,000,000 | 400,000 | 500,000 | 500,000 | 500,000 |
* GAA is General Appropriation Act.
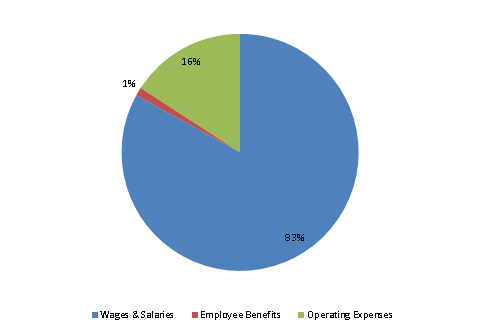
| SPENDING CATEGORY |
FY2009 Expended |
FY2010 Expended |
FY2011 Expended |
FY2012 Projected |
FY2013 GAA |
|---|---|---|---|---|---|
| Wages & Salaries | 714 | 664 | 339 | 300 | 415 |
| Employee Benefits | 15 | 14 | 7 | 7 | 6 |
| Operating Expenses | 117 | 102 | 79 | 193 | 79 |
| Safety Net | 70 | 0 | 0 | 0 | 0 |
| TOTAL | 917 | 781 | 425 | 500 | 500 |
FY2013 Spending Category Chart