|
FY2013 House 1 |
FY2013 House Final |
FY2013 Senate Final |
FY2013 GAA |
|
|---|---|---|---|---|
| Budget Tracking | 15,519,254 | 14,258,336 | 14,400,919 | 14,258,336 |
|
FY2010 GAA |
FY2011 GAA |
FY2012 GAA |
FY2012 Projected |
FY2013 GAA |
|
|---|---|---|---|---|---|
| Historical Budget Levels | 14,584,616 | 14,221,459 | 14,108,413 | 15,519,254 | 14,258,336 |
* GAA is General Appropriation Act.
| SPENDING CATEGORY |
FY2009 Expended |
FY2010 Expended |
FY2011 Expended |
FY2012 Projected |
FY2013 GAA |
|---|---|---|---|---|---|
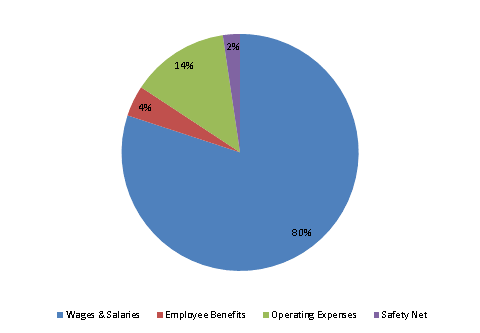
| Wages & Salaries | 12,136 | 11,389 | 11,546 | 11,170 | 11,414 |
| Employee Benefits | 597 | 606 | 612 | 687 | 600 |
| Operating Expenses | 2,598 | 2,180 | 1,931 | 3,276 | 1,911 |
| Safety Net | 457 | 363 | 272 | 386 | 333 |
| TOTAL | 15,788 | 14,538 | 14,361 | 15,519 | 14,258 |
FY2013 Spending Category Chart
