|
FY2013 House 1 |
FY2013 House Final |
FY2013 Senate Final |
FY2013 GAA |
|
|---|---|---|---|---|
| Budget Tracking | 15,250,724 | 15,989,884 | 17,588,733 | 16,763,773 |
|
FY2010 GAA |
FY2011 GAA |
FY2012 GAA |
FY2012 Projected |
FY2013 GAA |
|
|---|---|---|---|---|---|
| Historical Budget Levels | 14,394,926 | 16,861,169 | 17,384,374 | 17,384,375 | 16,763,773 |
* GAA is General Appropriation Act.
| SPENDING CATEGORY |
FY2009 Expended |
FY2010 Expended |
FY2011 Expended |
FY2012 Projected |
FY2013 GAA |
|---|---|---|---|---|---|
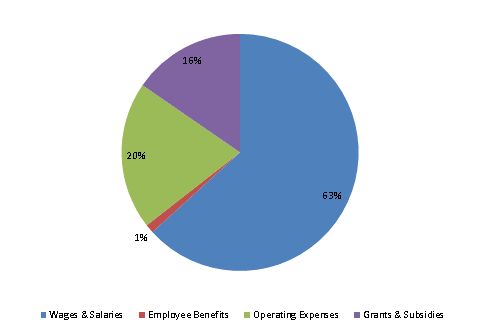
| Wages & Salaries | 7,614 | 7,154 | 7,441 | 7,999 | 10,603 |
| Employee Benefits | 135 | 113 | 158 | 167 | 199 |
| Operating Expenses | 2,163 | 2,812 | 2,746 | 2,934 | 3,380 |
| Grants & Subsidies | 6,069 | 3,540 | 5,969 | 6,285 | 2,582 |
| TOTAL | 15,981 | 13,618 | 16,314 | 17,384 | 16,764 |
FY2013 Spending Category Chart
