|
FY2013 House 1 |
FY2013 House Final |
FY2013 Senate Final |
FY2013 GAA |
|
|---|---|---|---|---|
| Budget Tracking | 20,139,642 | 20,139,642 | 20,139,642 | 20,139,642 |
|
FY2010 GAA |
FY2011 GAA |
FY2012 GAA |
FY2012 Projected |
FY2013 GAA |
|
|---|---|---|---|---|---|
| Historical Budget Levels | 19,388,959 | 19,884,626 | 20,139,642 | 20,139,642 | 20,139,642 |
* GAA is General Appropriation Act.
| SPENDING CATEGORY |
FY2009 Expended |
FY2010 Expended |
FY2011 Expended |
FY2012 Projected |
FY2013 GAA |
|---|---|---|---|---|---|
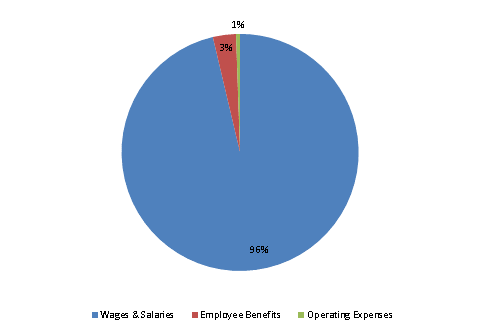
| Wages & Salaries | 21,524 | 17,639 | 20,007 | 19,757 | 19,396 |
| Employee Benefits | 284 | 244 | 386 | 268 | 633 |
| Operating Expenses | 121 | 0 | 0 | 114 | 111 |
| TOTAL | 21,929 | 17,883 | 20,393 | 20,140 | 20,140 |
FY2013 Spending Category Chart
