|
FY2013 House 1 |
FY2013 House Final |
FY2013 Senate Final |
FY2013 GAA |
|
|---|---|---|---|---|
| Budget Tracking | 1,405,317 | 1,405,317 | 1,405,317 | 1,405,317 |
|
FY2010 GAA |
FY2011 GAA |
FY2012 GAA |
FY2012 Projected |
FY2013 GAA |
|
|---|---|---|---|---|---|
| Historical Budget Levels | 0 | 0 | 1,367,409 | 1,367,409 | 1,405,317 |
* GAA is General Appropriation Act.
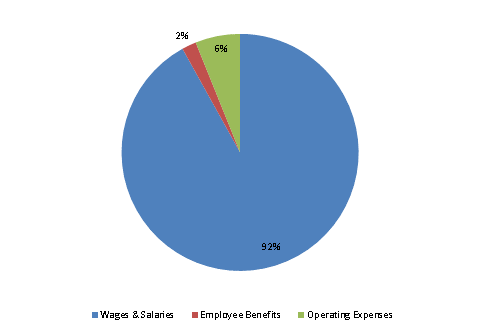
| SPENDING CATEGORY |
FY2009 Expended |
FY2010 Expended |
FY2011 Expended |
FY2012 Projected |
FY2013 GAA |
|---|---|---|---|---|---|
| Wages & Salaries | 0 | 0 | 0 | 1,255 | 1,292 |
| Employee Benefits | 0 | 0 | 0 | 27 | 27 |
| Operating Expenses | 0 | 0 | 0 | 86 | 86 |
| TOTAL | 0 | 0 | 0 | 1,367 | 1,405 |
FY2013 Spending Category Chart