|
FY2013 House 1 |
FY2013 House Final |
FY2013 Senate Final |
FY2013 GAA |
|
|---|---|---|---|---|
| Budget Tracking | 9,575,175 | 9,575,175 | 9,094,804 | 9,575,175 |
|
FY2010 GAA |
FY2011 GAA |
FY2012 GAA |
FY2012 Projected |
FY2013 GAA |
|
|---|---|---|---|---|---|
| Historical Budget Levels | 9,294,804 | 9,094,804 | 9,575,175 | 12,865,764 | 9,575,175 |
* GAA is General Appropriation Act.
| SPENDING CATEGORY |
FY2009 Expended |
FY2010 Expended |
FY2011 Expended |
FY2012 Projected |
FY2013 GAA |
|---|---|---|---|---|---|
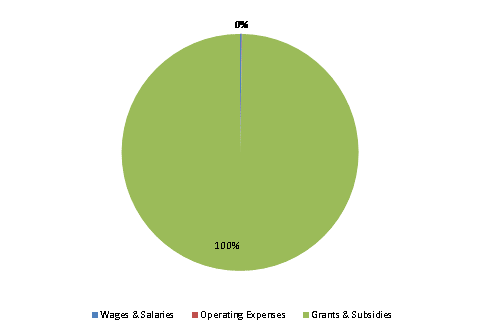
| Wages & Salaries | 19 | 20 | 20 | 24 | 22 |
| Employee Benefits | 2 | 0 | 0 | 0 | 0 |
| Operating Expenses | 36 | 23 | 30 | 5 | 5 |
| Grants & Subsidies | 12,671 | 9,692 | 9,156 | 12,836 | 9,548 |
| TOTAL | 12,728 | 9,736 | 9,207 | 12,866 | 9,575 |
FY2013 Spending Category Chart
