|
FY2013 House 1 |
FY2013 House Final |
FY2013 Senate Final |
FY2013 GAA |
|
|---|---|---|---|---|
| Budget Tracking | 30,707,455 | 29,923,112 | 30,707,455 | 30,174,160 |
|
FY2010 GAA |
FY2011 GAA |
FY2012 GAA |
FY2012 Projected |
FY2013 GAA |
|
|---|---|---|---|---|---|
| Historical Budget Levels | 28,085,096 | 27,702,108 | 27,702,108 | 30,702,600 | 30,174,160 |
* GAA is General Appropriation Act.
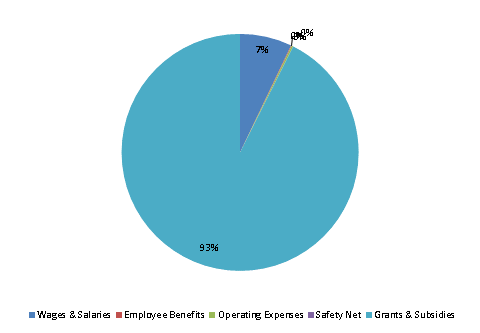
| SPENDING CATEGORY |
FY2009 Expended |
FY2010 Expended |
FY2011 Expended |
FY2012 Projected |
FY2013 GAA |
|---|---|---|---|---|---|
| Wages & Salaries | 2,294 | 2,363 | 2,147 | 2,126 | 2,135 |
| Employee Benefits | 16 | 16 | 19 | 25 | 27 |
| Operating Expenses | 1,058 | 63 | 60 | 64 | 69 |
| Safety Net | 0 | 0 | 7 | 0 | 2 |
| Grants & Subsidies | 26,561 | 25,421 | 25,385 | 28,487 | 27,942 |
| TOTAL | 29,928 | 27,863 | 27,617 | 30,703 | 30,174 |
FY2013 Spending Category Chart