|
FY2013 House 1 |
FY2013 House Final |
FY2013 Senate Final |
FY2013 GAA |
|
|---|---|---|---|---|
| Budget Tracking | 100,368,742 | 88,923,588 | 96,679,154 | 80,042,354 |
|
FY2010 GAA |
FY2011 GAA |
FY2012 GAA |
FY2012 Projected |
FY2013 GAA |
|
|---|---|---|---|---|---|
| Historical Budget Levels | 91,605,510 | 115,360,773 | 97,797,200 | 137,510,755 | 80,042,354 |
* GAA is General Appropriation Act.
| SPENDING CATEGORY |
FY2009 Expended |
FY2010 Expended |
FY2011 Expended |
FY2012 Projected |
FY2013 GAA |
|---|---|---|---|---|---|
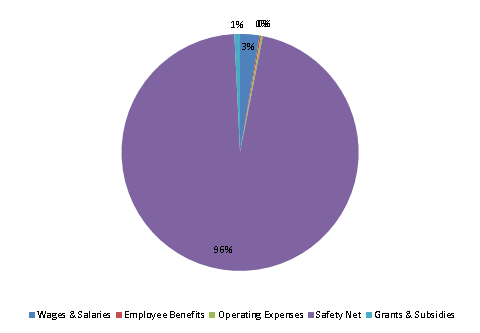
| Wages & Salaries | 0 | 1,815 | 2,190 | 2,204 | 2,105 |
| Employee Benefits | 0 | 122 | 136 | 134 | 158 |
| Operating Expenses | 0 | 30 | 50 | 46 | 209 |
| Safety Net | 0 | 147,049 | 155,209 | 133,727 | 76,950 |
| Grants & Subsidies | 0 | 1,634 | 1,400 | 1,400 | 620 |
| TOTAL | 0 | 150,651 | 158,984 | 137,511 | 80,042 |
FY2013 Spending Category Chart
