|
FY2013 House 1 |
FY2013 House Final |
FY2013 Senate Final |
FY2013 GAA |
|
|---|---|---|---|---|
| Budget Tracking | 7,064,734 | 6,742,317 | 6,964,734 | 7,289,734 |
|
FY2010 GAA |
FY2011 GAA |
FY2012 GAA |
FY2012 Projected |
FY2013 GAA |
|
|---|---|---|---|---|---|
| Historical Budget Levels | 6,895,062 | 6,607,910 | 6,742,317 | 6,752,317 | 7,289,734 |
* GAA is General Appropriation Act.
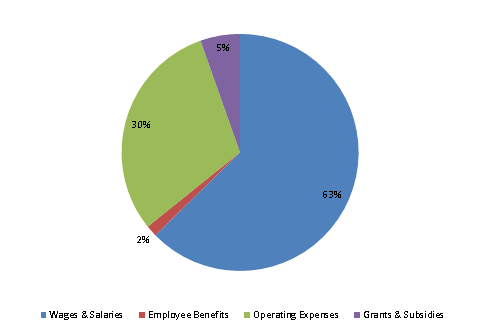
| SPENDING CATEGORY |
FY2009 Expended |
FY2010 Expended |
FY2011 Expended |
FY2012 Projected |
FY2013 GAA |
|---|---|---|---|---|---|
| Wages & Salaries | 5,389 | 4,602 | 4,520 | 4,235 | 4,569 |
| Employee Benefits | 90 | 76 | 97 | 110 | 112 |
| Operating Expenses | 2,383 | 2,061 | 2,022 | 2,122 | 2,213 |
| Safety Net | 0 | 0 | 62 | 10 | 0 |
| Grants & Subsidies | 864 | 0 | 0 | 275 | 395 |
| TOTAL | 8,725 | 6,739 | 6,702 | 6,752 | 7,290 |
FY2013 Spending Category Chart