|
FY2013 House 1 |
FY2013 House Final |
FY2013 Senate Final |
FY2013 GAA |
|
|---|---|---|---|---|
| Budget Tracking | 132,457,504 | 132,457,504 | 133,442,770 | 133,442,770 |
|
FY2010 GAA |
FY2011 GAA |
FY2012 GAA |
FY2012 Projected |
FY2013 GAA |
|
|---|---|---|---|---|---|
| Historical Budget Levels | 161,581,427 | 149,993,472 | 142,156,836 | 152,794,942 | 133,442,770 |
* GAA is General Appropriation Act.
| SPENDING CATEGORY |
FY2009 Expended |
FY2010 Expended |
FY2011 Expended |
FY2012 Projected |
FY2013 GAA |
|---|---|---|---|---|---|
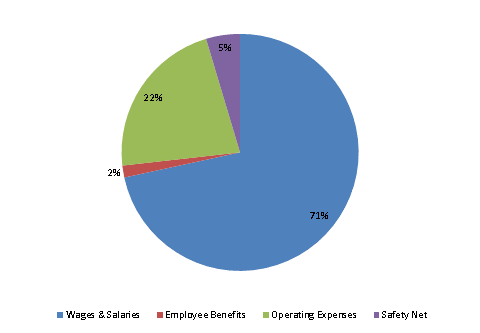
| Wages & Salaries | 129,724 | 121,586 | 113,948 | 102,073 | 95,540 |
| Employee Benefits | 1,861 | 1,912 | 2,480 | 2,316 | 2,166 |
| Operating Expenses | 41,080 | 36,641 | 36,816 | 42,177 | 29,554 |
| Safety Net | 6,241 | 3,998 | 6,324 | 6,228 | 6,182 |
| TOTAL | 178,906 | 164,137 | 159,568 | 152,795 | 133,443 |
FY2013 Spending Category Chart
