|
FY2013 House 1 |
FY2013 House Final |
FY2013 Senate Final |
FY2013 GAA |
|
|---|---|---|---|---|
| Budget Tracking | 4,635,921 | 4,633,316 | 4,637,858 | 4,635,252 |
|
FY2010 GAA |
FY2011 GAA |
FY2012 GAA |
FY2012 Projected |
FY2013 GAA |
|
|---|---|---|---|---|---|
| Historical Budget Levels | 4,123,387 | 4,128,480 | 4,621,177 | 4,622,567 | 4,635,252 |
* GAA is General Appropriation Act.
| SPENDING CATEGORY |
FY2009 Expended |
FY2010 Expended |
FY2011 Expended |
FY2012 Projected |
FY2013 GAA |
|---|---|---|---|---|---|
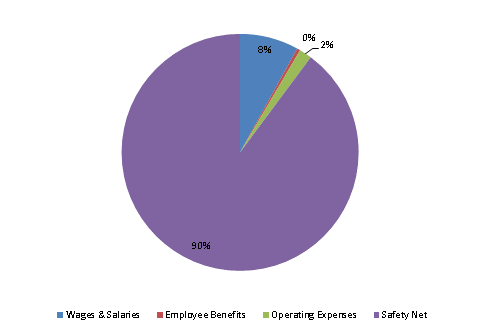
| Wages & Salaries | 359 | 301 | 340 | 348 | 371 |
| Employee Benefits | 17 | 15 | 17 | 27 | 21 |
| Operating Expenses | 226 | 4 | 38 | 45 | 80 |
| Safety Net | 2,798 | 2,994 | 3,363 | 4,203 | 4,164 |
| TOTAL | 3,400 | 3,315 | 3,758 | 4,623 | 4,635 |
FY2013 Spending Category Chart
