|
FY2013 House 1 |
FY2013 House Final |
FY2013 Senate Final |
FY2013 GAA |
|
|---|---|---|---|---|
| Budget Tracking | 1,006,253 | 1,500,000 | 1,007,431 | 1,501,178 |
|
FY2010 GAA |
FY2011 GAA |
FY2012 GAA |
FY2012 Projected |
FY2013 GAA |
|
|---|---|---|---|---|---|
| Historical Budget Levels | 2,000,000 | 1,500,000 | 1,000,000 | 1,000,000 | 1,501,178 |
* GAA is General Appropriation Act.
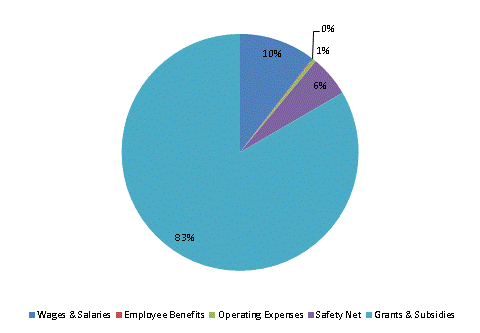
| SPENDING CATEGORY |
FY2009 Expended |
FY2010 Expended |
FY2011 Expended |
FY2012 Projected |
FY2013 GAA |
|---|---|---|---|---|---|
| Wages & Salaries | 93 | 181 | 165 | 149 | 157 |
| Employee Benefits | 1 | 2 | 4 | 3 | 2 |
| Operating Expenses | 7 | 13 | 12 | 1 | 7 |
| Safety Net | 274 | 163 | 82 | 84 | 84 |
| Grants & Subsidies | 2,903 | 1,601 | 1,232 | 763 | 1,252 |
| TOTAL | 3,278 | 1,959 | 1,494 | 1,000 | 1,501 |
FY2013 Spending Category Chart