|
FY2013 House 1 |
FY2013 House Final |
FY2013 Senate Final |
FY2013 GAA |
|
|---|---|---|---|---|
| Budget Tracking | 794,666 | 794,666 | 896,051 | 821,051 |
|
FY2010 GAA |
FY2011 GAA |
FY2012 GAA |
FY2012 Projected |
FY2013 GAA |
|
|---|---|---|---|---|---|
| Historical Budget Levels | 786,444 | 786,444 | 790,732 | 790,732 | 821,051 |
* GAA is General Appropriation Act.
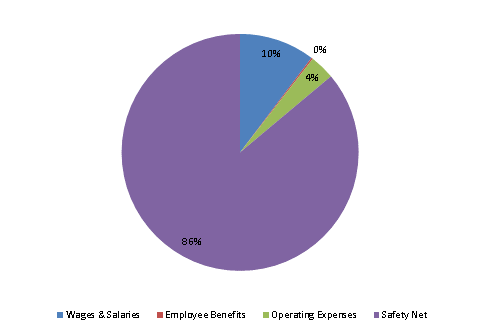
| SPENDING CATEGORY |
FY2009 Expended |
FY2010 Expended |
FY2011 Expended |
FY2012 Projected |
FY2013 GAA |
|---|---|---|---|---|---|
| Wages & Salaries | 70 | 75 | 77 | 81 | 85 |
| Employee Benefits | 4 | 2 | 2 | 2 | 2 |
| Operating Expenses | 0 | 1 | 1 | 1 | 28 |
| Safety Net | 703 | 706 | 707 | 707 | 707 |
| TOTAL | 778 | 785 | 786 | 791 | 821 |
FY2013 Spending Category Chart