|
FY2013 House 1 |
FY2013 House Final |
FY2013 Senate Final |
FY2013 GAA |
|
|---|---|---|---|---|
| Budget Tracking | 1,352,558 | 1,401,531 | 1,401,531 | 1,403,897 |
|
FY2010 GAA |
FY2011 GAA |
FY2012 GAA |
FY2012 Projected |
FY2013 GAA |
|
|---|---|---|---|---|---|
| Historical Budget Levels | 1,424,477 | 1,412,792 | 1,395,761 | 1,395,760 | 1,403,897 |
* GAA is General Appropriation Act.
| SPENDING CATEGORY |
FY2009 Expended |
FY2010 Expended |
FY2011 Expended |
FY2012 Projected |
FY2013 GAA |
|---|---|---|---|---|---|
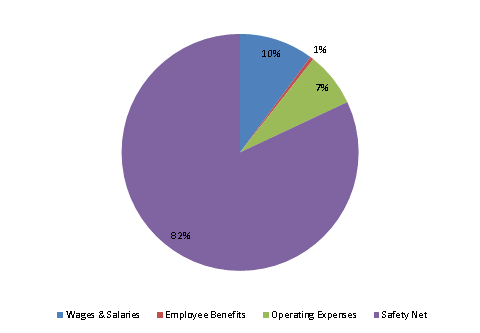
| Wages & Salaries | 55 | 84 | 126 | 133 | 142 |
| Employee Benefits | 2 | 2 | 6 | 8 | 7 |
| Operating Expenses | 126 | 104 | 99 | 104 | 104 |
| Safety Net | 2,227 | 1,187 | 1,154 | 1,151 | 1,151 |
| TOTAL | 2,411 | 1,377 | 1,384 | 1,396 | 1,404 |
FY2013 Spending Category Chart
