|
FY2013 House 1 |
FY2013 House Final |
FY2013 Senate Final |
FY2013 GAA |
|
|---|---|---|---|---|
| Budget Tracking | 32,101,023 | 32,097,810 | 32,101,023 | 32,101,023 |
|
FY2010 GAA |
FY2011 GAA |
FY2012 GAA |
FY2012 Projected |
FY2013 GAA |
|
|---|---|---|---|---|---|
| Historical Budget Levels | 35,335,527 | 33,097,810 | 31,597,810 | 32,097,810 | 32,101,023 |
* GAA is General Appropriation Act.
| SPENDING CATEGORY |
FY2009 Expended |
FY2010 Expended |
FY2011 Expended |
FY2012 Projected |
FY2013 GAA |
|---|---|---|---|---|---|
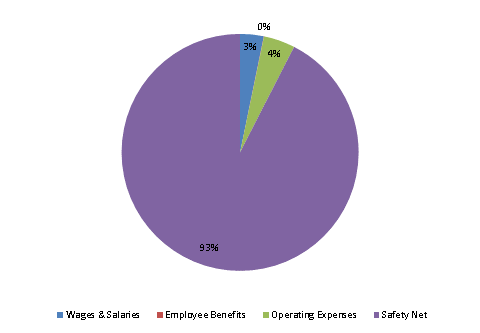
| Wages & Salaries | 768 | 1,086 | 1,125 | 1,014 | 1,028 |
| Employee Benefits | 7 | 9 | 15 | 17 | 15 |
| Operating Expenses | 2,448 | 1,905 | 1,690 | 1,375 | 1,375 |
| Safety Net | 32,552 | 32,175 | 30,099 | 29,692 | 29,683 |
| TOTAL | 35,775 | 35,177 | 32,929 | 32,098 | 32,101 |
FY2013 Spending Category Chart
