|
FY2013 House 1 |
FY2013 House Final |
FY2013 Senate Final |
FY2013 GAA |
|
|---|---|---|---|---|
| Budget Tracking | 3,207,518 | 3,313,711 | 3,231,212 | 3,386,819 |
|
FY2010 GAA |
FY2011 GAA |
FY2012 GAA |
FY2012 Projected |
FY2013 GAA |
|
|---|---|---|---|---|---|
| Historical Budget Levels | 3,160,567 | 3,176,362 | 3,205,454 | 3,205,453 | 3,386,819 |
* GAA is General Appropriation Act.
| SPENDING CATEGORY |
FY2009 Expended |
FY2010 Expended |
FY2011 Expended |
FY2012 Projected |
FY2013 GAA |
|---|---|---|---|---|---|
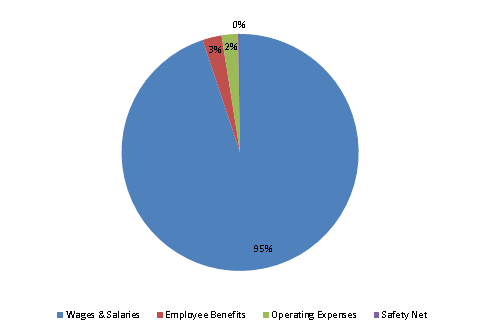
| Wages & Salaries | 3,467 | 2,912 | 3,046 | 3,030 | 3,213 |
| Employee Benefits | 93 | 69 | 76 | 88 | 88 |
| Operating Expenses | 107 | 65 | 65 | 77 | 75 |
| Safety Net | 35 | 20 | 10 | 10 | 10 |
| TOTAL | 3,701 | 3,066 | 3,196 | 3,205 | 3,387 |
FY2013 Spending Category Chart
