|
FY2013 House 1 |
FY2013 House Final |
FY2013 Senate Final |
FY2013 GAA |
|
|---|---|---|---|---|
| Budget Tracking | 3,171,411 | 3,060,177 | 3,112,972 | 3,097,436 |
|
FY2010 GAA |
FY2011 GAA |
FY2012 GAA |
FY2012 Projected |
FY2013 GAA |
|
|---|---|---|---|---|---|
| Historical Budget Levels | 2,355,724 | 2,880,694 | 2,933,683 | 2,789,101 | 3,097,436 |
* GAA is General Appropriation Act.
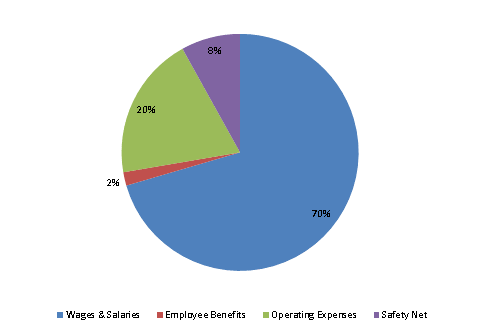
| SPENDING CATEGORY |
FY2009 Expended |
FY2010 Expended |
FY2011 Expended |
FY2012 Projected |
FY2013 GAA |
|---|---|---|---|---|---|
| Wages & Salaries | 577 | 1,399 | 1,857 | 2,022 | 2,183 |
| Employee Benefits | 18 | 26 | 48 | 55 | 57 |
| Operating Expenses | 494 | 529 | 713 | 462 | 608 |
| Safety Net | 250 | 250 | 250 | 250 | 250 |
| Grants & Subsidies | 1,500 | 50 | 0 | 0 | 0 |
| TOTAL | 2,840 | 2,255 | 2,867 | 2,789 | 3,097 |
FY2013 Spending Category Chart