|
FY2013 House 1 |
FY2013 House Final |
FY2013 Senate Final |
FY2013 GAA |
|
|---|---|---|---|---|
| Budget Tracking | 11,215,519 | 11,215,519 | 11,236,019 | 11,215,519 |
|
FY2010 GAA |
FY2011 GAA |
FY2012 GAA |
FY2012 Projected |
FY2013 GAA |
|
|---|---|---|---|---|---|
| Historical Budget Levels | 11,209,371 | 11,171,360 | 11,171,360 | 11,171,360 | 11,215,519 |
* GAA is General Appropriation Act.
| SPENDING CATEGORY |
FY2009 Expended |
FY2010 Expended |
FY2011 Expended |
FY2012 Projected |
FY2013 GAA |
|---|---|---|---|---|---|
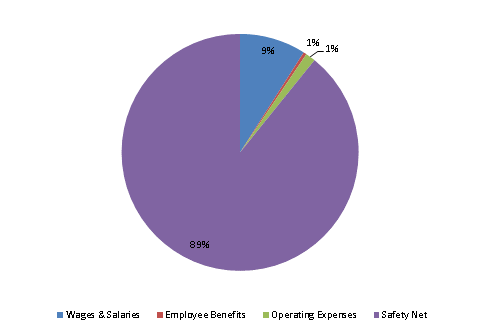
| Wages & Salaries | 916 | 912 | 955 | 1,002 | 1,012 |
| Employee Benefits | 57 | 49 | 54 | 53 | 47 |
| Operating Expenses | 151 | 147 | 154 | 152 | 153 |
| Safety Net | 9,441 | 9,641 | 9,955 | 9,964 | 10,003 |
| TOTAL | 10,565 | 10,749 | 11,118 | 11,171 | 11,216 |
FY2013 Spending Category Chart
