|
FY2013 House 1 |
FY2013 House Final |
FY2013 Senate Final |
FY2013 GAA |
|
|---|---|---|---|---|
| Budget Tracking | 12,229,279 | 12,279,279 | 12,655,279 | 12,679,279 |
|
FY2010 GAA |
FY2011 GAA |
FY2012 GAA |
FY2012 Projected |
FY2013 GAA |
|
|---|---|---|---|---|---|
| Historical Budget Levels | 11,946,137 | 11,851,933 | 12,226,933 | 12,226,933 | 12,679,279 |
* GAA is General Appropriation Act.
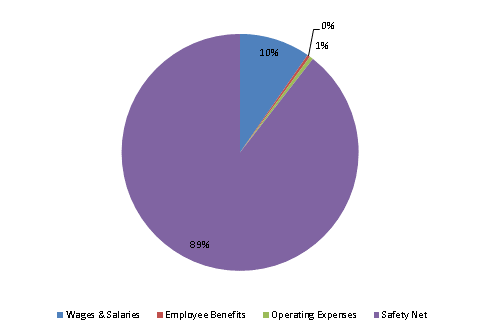
| SPENDING CATEGORY |
FY2009 Expended |
FY2010 Expended |
FY2011 Expended |
FY2012 Projected |
FY2013 GAA |
|---|---|---|---|---|---|
| Wages & Salaries | 1,179 | 1,041 | 1,114 | 1,220 | 1,223 |
| Employee Benefits | 44 | 38 | 48 | 50 | 49 |
| Operating Expenses | 84 | 69 | 86 | 76 | 64 |
| Safety Net | 9,808 | 10,225 | 10,371 | 10,881 | 11,343 |
| TOTAL | 11,115 | 11,374 | 11,619 | 12,227 | 12,679 |
FY2013 Spending Category Chart