|
FY2013 House 1 |
FY2013 House Final |
FY2013 Senate Final |
FY2013 GAA |
|
|---|---|---|---|---|
| Budget Tracking | 1,603,609 | 1,391,412 | 1,515,313 | 1,427,019 |
|
FY2010 GAA |
FY2011 GAA |
FY2012 GAA |
FY2012 Projected |
FY2013 GAA |
|
|---|---|---|---|---|---|
| Historical Budget Levels | 1,576,198 | 1,464,896 | 1,264,499 | 1,264,499 | 1,427,019 |
* GAA is General Appropriation Act.
| SPENDING CATEGORY |
FY2009 Expended |
FY2010 Expended |
FY2011 Expended |
FY2012 Projected |
FY2013 GAA |
|---|---|---|---|---|---|
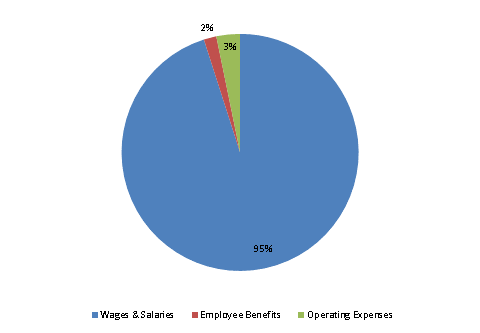
| Wages & Salaries | 1,537 | 1,455 | 1,380 | 1,184 | 1,356 |
| Employee Benefits | 39 | 27 | 31 | 28 | 25 |
| Operating Expenses | 38 | 29 | 22 | 53 | 46 |
| TOTAL | 1,614 | 1,512 | 1,433 | 1,264 | 1,427 |
FY2013 Spending Category Chart
