|
FY2013 House 1 |
FY2013 House Final |
FY2013 Senate Final |
FY2013 GAA |
|
|---|---|---|---|---|
| Budget Tracking | 1,468,565 | 1,429,572 | 1,465,603 | 1,461,641 |
|
FY2010 GAA |
FY2011 GAA |
FY2012 GAA |
FY2012 Projected |
FY2013 GAA |
|
|---|---|---|---|---|---|
| Historical Budget Levels | 1,957,473 | 1,657,263 | 1,667,239 | 1,667,238 | 1,461,641 |
* GAA is General Appropriation Act.
| SPENDING CATEGORY |
FY2009 Expended |
FY2010 Expended |
FY2011 Expended |
FY2012 Projected |
FY2013 GAA |
|---|---|---|---|---|---|
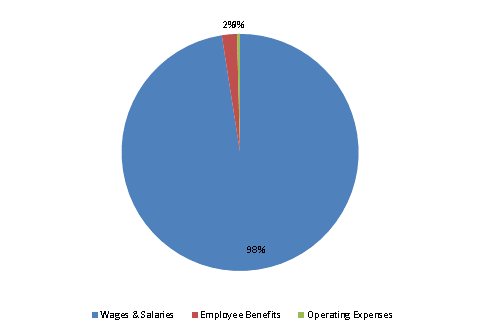
| Wages & Salaries | 1,739 | 1,599 | 1,533 | 1,626 | 1,426 |
| Employee Benefits | 24 | 23 | 31 | 34 | 30 |
| Operating Expenses | 6 | 5 | 5 | 7 | 6 |
| TOTAL | 1,770 | 1,627 | 1,569 | 1,667 | 1,462 |
FY2013 Spending Category Chart
