|
FY2013 House 1 |
FY2013 House Final |
FY2013 Senate Final |
FY2013 GAA |
|
|---|---|---|---|---|
| Budget Tracking | 2,088,156 | 1,780,156 | 2,104,972 | 1,804,972 |
|
FY2010 GAA |
FY2011 GAA |
FY2012 GAA |
FY2012 Projected |
FY2013 GAA |
|
|---|---|---|---|---|---|
| Historical Budget Levels | 1,394,271 | 1,100,000 | 2,033,299 | 1,733,299 | 1,804,972 |
* GAA is General Appropriation Act.
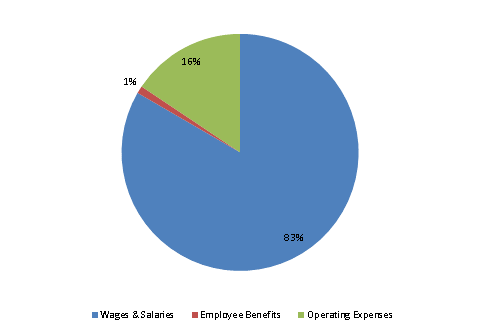
| SPENDING CATEGORY |
FY2009 Expended |
FY2010 Expended |
FY2011 Expended |
FY2012 Projected |
FY2013 GAA |
|---|---|---|---|---|---|
| Wages & Salaries | 1,618 | 1,236 | 1,043 | 1,559 | 1,505 |
| Employee Benefits | 9 | 8 | 14 | 21 | 18 |
| Operating Expenses | 88 | 77 | 118 | 153 | 282 |
| TOTAL | 1,715 | 1,322 | 1,175 | 1,733 | 1,805 |
FY2013 Spending Category Chart