|
FY2013 House 1 |
FY2013 House Final |
FY2013 Senate Final |
FY2013 GAA |
|
|---|---|---|---|---|
| Budget Tracking | 83,164,283 | 82,719,544 | 87,669,838 | 87,225,100 |
|
FY2010 GAA |
FY2011 GAA |
FY2012 GAA |
FY2012 Projected |
FY2013 GAA |
|
|---|---|---|---|---|---|
| Historical Budget Levels | 88,539,813 | 80,469,544 | 80,469,544 | 80,469,545 | 87,225,100 |
* GAA is General Appropriation Act.
| SPENDING CATEGORY |
FY2009 Expended |
FY2010 Expended |
FY2011 Expended |
FY2012 Projected |
FY2013 GAA |
|---|---|---|---|---|---|
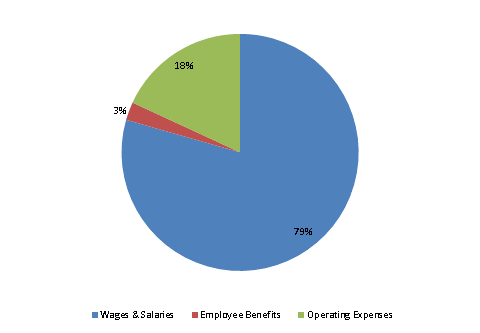
| Wages & Salaries | 86,124 | 67,819 | 65,767 | 66,280 | 69,280 |
| Employee Benefits | 2,329 | 1,818 | 2,226 | 2,129 | 2,156 |
| Operating Expenses | 24,489 | 12,152 | 13,062 | 12,060 | 15,789 |
| Safety Net | 0 | 0 | 0 | 0 | 0 |
| Grants & Subsidies | 0 | 0 | 1,000 | 0 | 0 |
| TOTAL | 112,941 | 81,789 | 82,054 | 80,470 | 87,225 |
FY2013 Spending Category Chart
