|
FY2013 House 1 |
FY2013 House Final |
FY2013 Senate Final |
FY2013 GAA |
|
|---|---|---|---|---|
| Budget Tracking | 1,128,302 | 1,077,553 | 1,135,991 | 1,077,553 |
|
FY2010 GAA |
FY2011 GAA |
FY2012 GAA |
FY2012 Projected |
FY2013 GAA |
|
|---|---|---|---|---|---|
| Historical Budget Levels | 1,102,462 | 1,097,910 | 1,077,076 | 1,077,076 | 1,077,553 |
* GAA is General Appropriation Act.
| SPENDING CATEGORY |
FY2009 Expended |
FY2010 Expended |
FY2011 Expended |
FY2012 Projected |
FY2013 GAA |
|---|---|---|---|---|---|
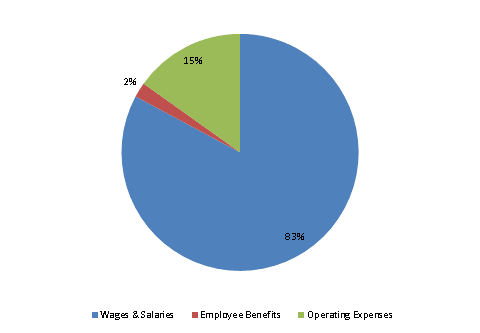
| Wages & Salaries | 1,109 | 947 | 816 | 895 | 892 |
| Employee Benefits | 16 | 14 | 17 | 20 | 22 |
| Operating Expenses | 219 | 178 | 205 | 162 | 163 |
| TOTAL | 1,343 | 1,139 | 1,037 | 1,077 | 1,078 |
FY2013 Spending Category Chart
